


Introduction
Binomial distribution may be approximated, under certain circumstances, by Poisson distribution, or normal distribution. One practical advantage is that the calculations for finding probabilities are much less tedious to perform.
Okay. Let me post this STPM 2015 Term 3 Mathematics (T) Coursework sample solution. before my holiday. 😀 No any comments will be replied until i am back from my holiday. Thanks. You still can leave any comment and i will review the comment as soon as possible. Remember, all the below are my personal opinions, please ask your school teachers for confirmation. I help you and you help others. Please share the information from your teachers too. Cheers.
Sample Question
Binomial distribution may be approximated, under certain circumstances, by Poisson distribution or normal distribution. One practical advantage is that the calculations for finding probabilities are much less tedious to perform.
1. Consider a random variable having binomial distribution B(n, p).
(a) Let p=0.05 and n=5, 10 and 20. Tabulate all the probabilities using binomial distribution, Poisson distribution and normal distribution. (Note: For n=5. manual calculations must be used)
(b) Repeat step 1(a) for p = 0.1 and 0.5.
2
(a) Illustrate graphically the probability distributions.
(b) Compare the probability distributions obtained and discuss your findings.
3. Investigate what happens when n increases.
Sample Solution for n=5, p=0.05
For binomial distribution B(n,p) where n=5, p=0.05, below are the sample calculations for using the binomial distribution, Poisson distribution, and normal distribution.
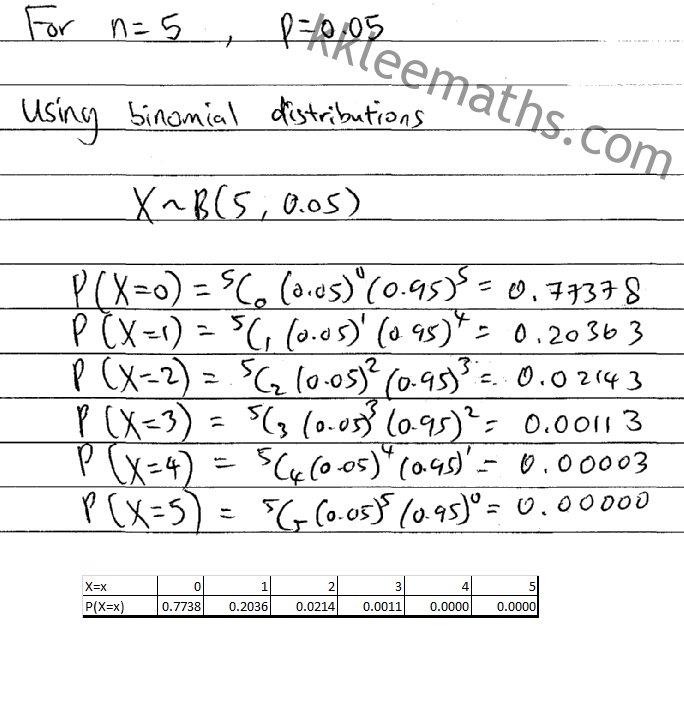
Table for binomial distribution n=10,p=0.05
Binomial Distribution
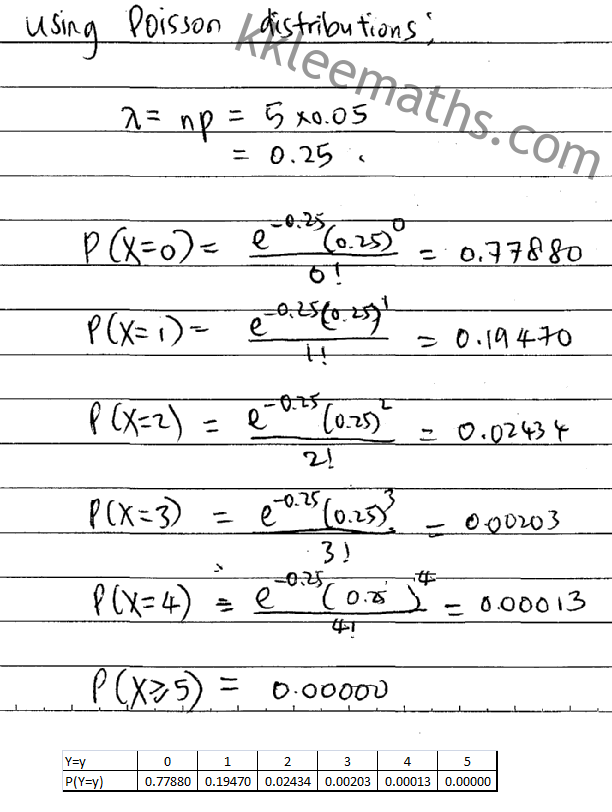
Table for Poisson distribution n=10,p=0.05
Poisson Distribution
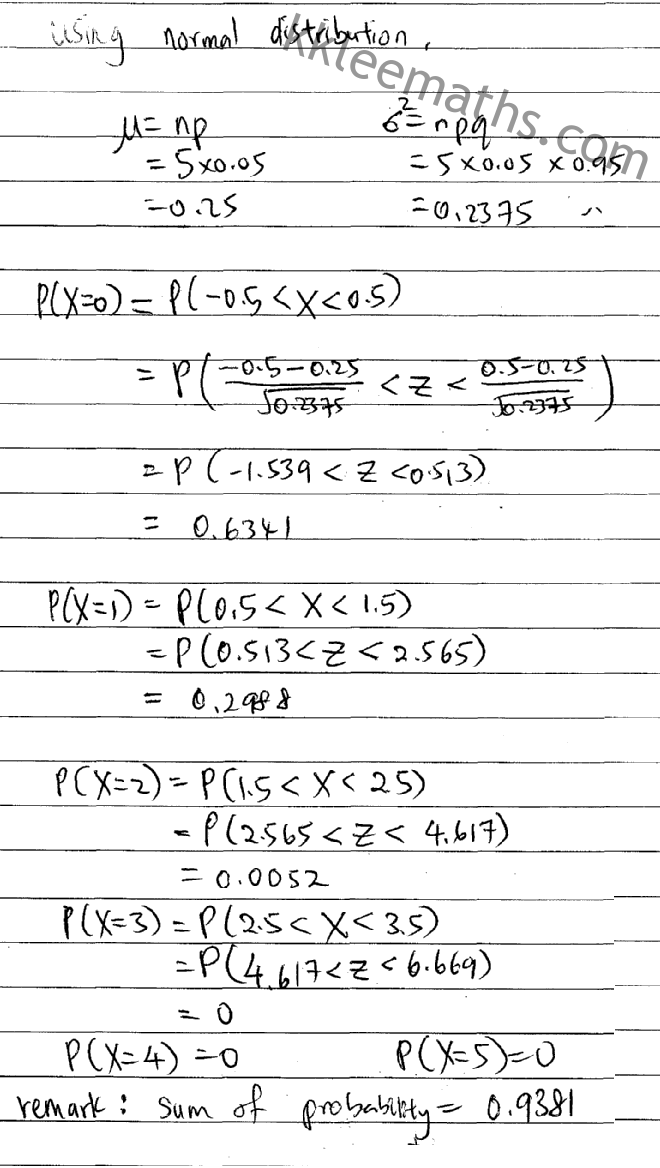
Table for normal distribution n=10,p=0.05
Normal Distribution
Remark. For normal distribution’s calculation above, the total probabilities are 0.9381, so i will suggest you add another 0.0619 to the probability for x=0. So that the total can be 1.00. Please ask your teacher and let me know. 🙂
Sample Graph
Graphs of binomial and Poisson distributions based on the above table. You should construct similar graph for normal distributions.

Graph for Binomial n=10, p=0.05
Sample graph for Binomial Distribution
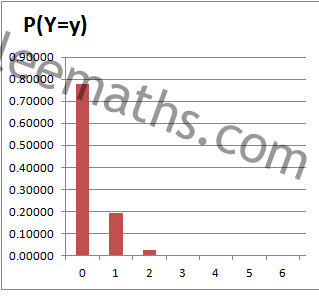
Graph for Poisson n=10, p=0.05
Sample graph for Poisson Distribution
Sample Solution for n=10, p=0.05
For binomial distribution B(n,p) where n=10, p=0.05, below are the sample tables and graphs for the distributions. Please do the calculations yourself.

Table and graph using binomial distribution n=10, p=0.05
Binomial Distribution
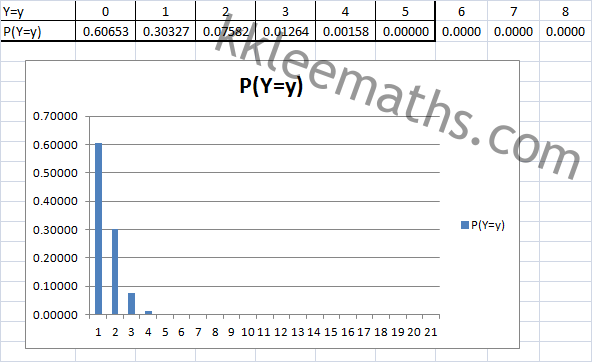
Table and graph using Poisson distribution n=10, p=0.05
Poisson Distribution
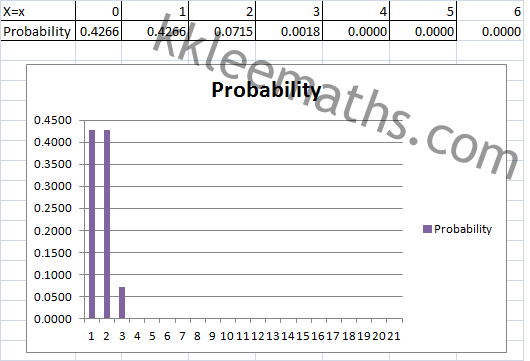
Table and graph using normal distribution n=10, p=0.05
Normal Distribution
Sample solutions for others
For n=20, p=0.05
For n=5, p=0.1
For n=5, p=0.5
For n=10, p=0.1
For n=10, p=0.5
For n=20, p=0.1
For n=20, p=0.5
For non KK LEE students, please do yourself.
For KK LEE students, please do yourself and visit the students corner at kkleemaths.com for downloadable excel file of all the tables and graphs for reference. We will discuss in class soon. There are two versions of excel files. The latest updated excel file contains tables and graphs which are combined together. Cheers.
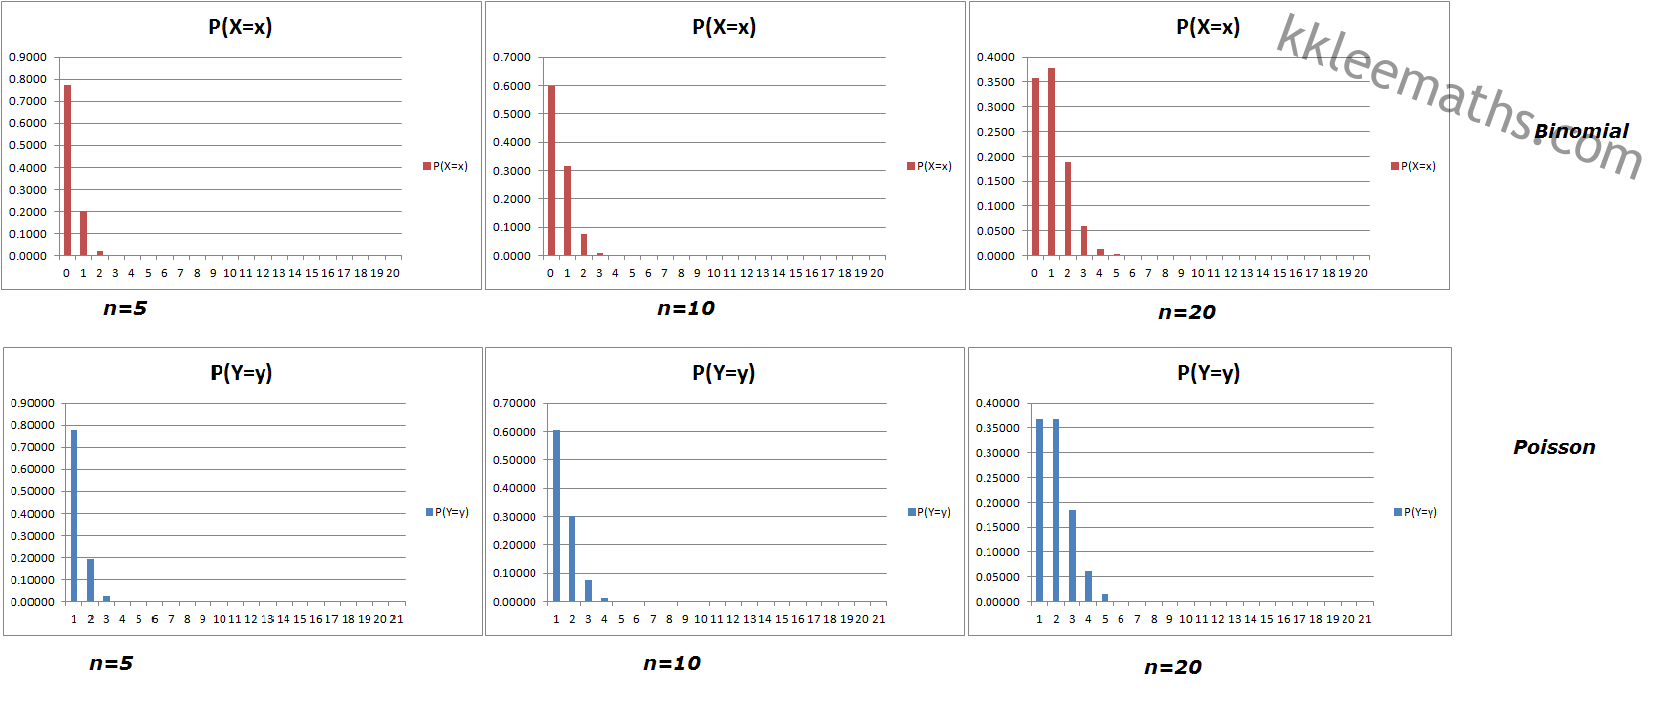
Comparison for p=0.05 (different values of n)
The shapes of the Poisson distribution and the binomial distribution are similar for p=0.05.
The graphs are not symmetrical an skewed to the left. So normal approximation are not suitable in these cases. When n increases, the distributions for p=0.05 are also skewed to the left. When the n is more than 100, the binomial distributions are almost symmetrical. The shape of binomial distributions tends to symmetrical as the n increases after n=100.
Comparison for p=0.1 and 0.5 (different values of n)
Please do yourself. Construct the graphs and see and investigate.
** For p=0.5, as n increases, the shape of binomial distribution is always symmetrical.
** You can try to make conclusion about the conditions for normal approximations(np>5, nq>5) and Poisson approximations(small p).
I will list down all the requirements from all the school teachers that i received here. Please share. Cheers
** Do for p=0.9
Here are our most recent updates posts
- Feel free to check it out -
STPM 2017 Term 3 Mathematics (M) Coursework Sample Answer
Question An entrepreneur is contemplating to purchase a brand new sealing machine winch costs RM90 000. The machine can be purchased through financing packages provided by 3 suppliers. All suppliers require 30% down payment. 1. Suppliers A, B and C offer a financing...
STPM 2017 Mathematics (T) Term 3 Coursework Sample
STPM 2017 Term 3 MT Coursework Explained. "Only sample solution for mathematical part will be posted. Please ask your school teacher for introduction, methodology, and conclusion." —00 It is reported that Malaysian youths spend many hours daily to access ...

STPM 2017 Term 2 Mathematics (T) Coursework
STPM 2017 Term 2 MT Coursework Explained. —00 In the application in science and technology, some definite integrals are difficult to evaluate by the usual integration techniques. It is a common practice to approximate a definite integral by integrating the first...
STPM 2016 Mathematics (T) Term 3 Revision 1 Sample Solution
Here are our most recent updates posts- Feel free to check it out -
STPM Mathematics (M) Term 3 Assignment
2016 Term 3 Question Received! Save Save Save STPM 2016 Term 3 Mathematics (M) Assignment Thanks for submitting the question paper. In a two-person zero-sum game, the gain of one player is the loss of the other. Play-safe strategies are adopted in a game having a...
STPM 2017 Mathematics (M) Term 1 Assignment
Sample solution of STPM 2017 Term 1 Mathematics (M) PBS coursework assignment

Dear sir,for example n =20, do we need calculate untill p(x=20)..and how many significant number we should take?
Hi. It depends on your teacher. For me, YES!
Sir, for the graph, you said do the calculation but what is that calculation you mean? Can you give me some hints about Q2b and 3
You need to show all the calculations(or workings) to obtains the probabilities.
Not really understand. Can explain more?
Similar to the calculation for n=5 and p=0.05. Please use the formula to find all the probabilities.
Sir, can I use smooth line graph instead of bar graph?
Vertical line
Sir,how to compare the graph if I do 3 probabilities(binomial,poisson,normal) in one graph ?
Compare their shapes
sir,how to do Q2b and Q3? because i not really understand.
Please refer the above
Sir, for the normal distribution involving n=5 and p=0.05,
since usually normal distributions involve P(Xx), using P(X=x) = P(x-0.5<X<x+0.5) would naturally mean using normal distribution as an approximate for binomial distribution..so maybe that is why it is off by 0.0619
still, for this question, we can't do using normal distribution..so we have to use the continuity correction method, correct?
Yes
Oh, ok..thank you sir
sorry sir, I want to ask why we can use continuity correction in 1(a)-normal distribution? because the np and nq we found all less than 5 but the condition of continuity correction is used when np and nq greater than 5.
That’s why the result will show you the normal approximation is not suitable.
sir, i dont quite understand the calculation for the normal distribution part. why is the x is between -0.5 and 0.5
Continuity correction.
Sir, may i ask the purpose of adding another 0.0619 to the probability for x=0 (Normal distribution). That won’t be the correct value for P(X=0) isn’t it ?
What i mean is if your school teacher wants the addition, then you add the values. Else, leave it there.
Alright, thank you sir
do we need to show normal distribution graph ?
It depends on your teacher
So i need to calculate to n=100 to investigate what happens when n increase?
It depends on your teacher. For me, yes
Sir, can i know how to do the conclusion?? Thank you sir
No comment. Thanks
graph for p=0.05 should be skew to right isnt it?
ya
Hi sir, are you sure that the graphs are skewed to the left? Shouldn’t they be skewed to the right as more data is on the left side?
You can edit yourself
Sir, how to compare probability distribution ? Isn;t explain difference of the graph?? What is meant by discussion your finding from the question???
Please ask your school teacher what he/she wants. Basically is explain the difference between the graphs.
sir, may i know how to compare the probability distributions obtained? what should i write in these question?
Please ask your school teacher what he/she wants. Basically is explain the difference between the graphs.
ok..thankq sir..
ehmm..for the question when n increase, we need to use any bigger value of n do with different value p?
It depends on your teacher
sir, why the graph is bar not vertical line??
You can always change to any shape you like.
Sir, since we are doing n=5 , p=0.1, after that we are also doing n=10 p=0.1, will the first five readings be the same in n=10 for binomial..
No
Sir , may i know that why i calculate the binomial distribution for n=20 p=0.05 by using computer , and the result showing is negative ?
Sir , how many graph should i plot??
It depends on your teacher.
Sir, question 3 need to draw combine graph??
Hmm.. It depends on your teacher. For me, no.
Sir how to write the methodology? pls help
Hi. Please refer your school teacher.
is the bar graph suitable for binomial,poisson and normal distribution ??can use line graph or not??
You can use any graphs. Line or bar or curve. It depends on your school teacher.
Hi Sir, what we need to compare for 2(b)? we need to compare between binomial, poisson and normal or comapre within binomial/ poisson/ normal (ex: when n is fixed and p changes from 0.05 to 0.5)?
Yes. Compare everything. Or you can refer to your teacher
Excuse me, sir. May I know do i need to use manual calculation for p=0.1 and n=5? and also p=0.5, n=5
It depends on your teacher.
Hello sir. As I do the calculation for larger number of n, the value I get is getting smaller, until 1*10^-9. In this case, should I state the answer as ”0” or express the number in standard form?
It depends on your teacher.
sir, if how much significant figures do i need for all the values?
is four is 4 s.g.f is ok?
It depends on your teacher.