


—00
It is reported that Malaysian youths spend many hours daily to access the social media such as Facebook and WhatsApp. This phenomenon leads to deterioration of social ties and values.
In this assignment, you are required to conduct a study on the time spent daily by the students in your school to access the social media.
—01
(a)
Discuss the various sampling techniques that can be used to collect data.
(b)
Choose a suitable sampling technique to collect data on time spent daily (in minutes) for a random sample of n students.
—02
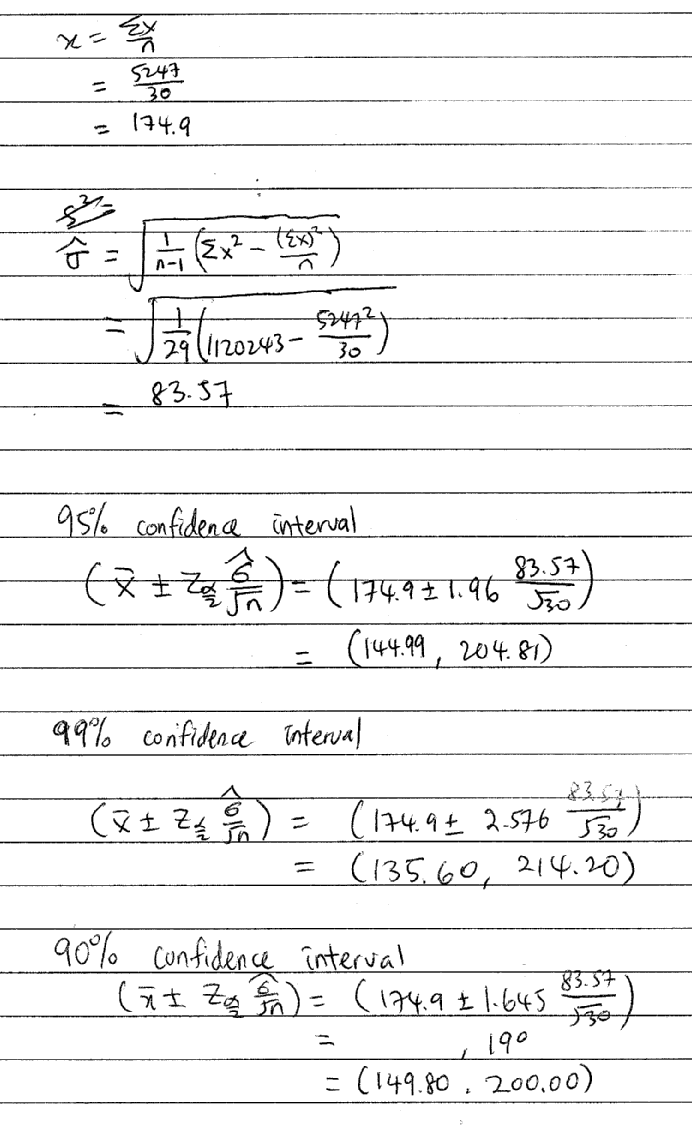
Construct three confidence intervals for the mean time spent daily by students in your school to access the social media. Interpret your results.

—03
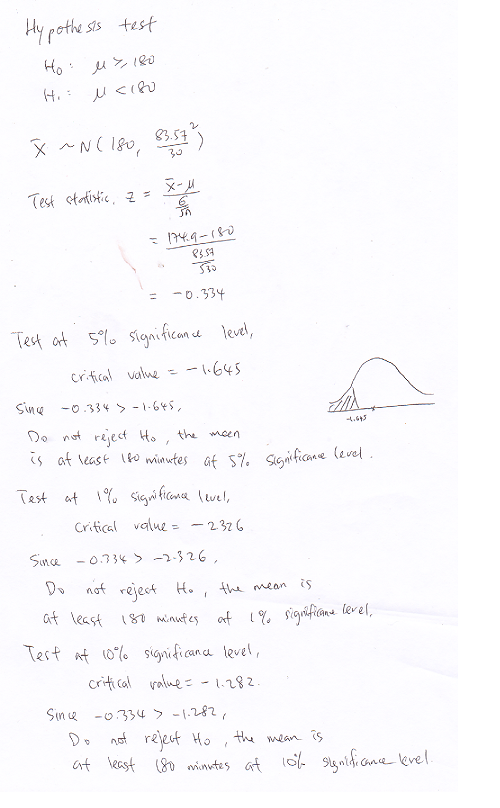
Determine whether the average time spent daily by the students in your school to access the
social media is at least three hours.
—04
State any assumptions made in Task 2 and Task 3. Discuss the validity of your results.
—01(a)
Reference: https://onlinecourses.science.psu.edu/stat100/node/18
Please find other resources yourself.
Sampling Methods can be classified into one of two categories:
Probability Sampling: Sample has a known probability of being selected
Non-probability Sampling: Sample does not have known probability of being selected as in convenience or voluntary response surveys
Probability Sampling
In probability sampling it is possible to both determine which sampling units belong to which sample and the probability that each sample will be selected. The following sampling methods are examples of probability sampling:
- Simple Random Sampling (SRS)
- Stratified Sampling
- Cluster Sampling
- Systematic Sampling
- Multistage Sampling (in which some of the methods above are combined in stages)
Of the five methods listed above, students have the most trouble distinguishing between stratified sampling and cluster sampling.
Stratified Sampling is possible when it makes sense to partition the population into groups based on a factor that may influence the variable that is being measured. These groups are then called strata. An individual group is called a stratum. With stratified sampling one should:
- partition the population into groups (strata)
- obtain a simple random sample from each group (stratum)
- collect data on each sampling unit that was randomly sampled from each group (stratum)
Stratified sampling works best when a heterogeneous population is split into fairly homogeneous groups. Under these conditions, stratification generally produces more precise estimates of the population percents than estimates that would be found from a simple random sample.
Cluster Sampling is very different from Stratified Sampling. With cluster sampling one should
- divide the population into groups (clusters).
- obtain a simple random sample of so many clusters from all possible clusters.
- obtain data on every sampling unit in each of the randomly selected clusters.
It is important to note that, unlike with the strata in stratified sampling, the clusters should be microcosms, rather than subsections, of the population. Each cluster should be heterogeneous. Additionally, the statistical analysis used with cluster sampling is not only different, but also more complicated than that used with stratified sampling.
Non-probability Sampling
The following sampling methods that are listed in your text are types of non-probability sampling that should be avoided:
- volunteer samples
- haphazard (convenience) samples
—01 (b)
Define the survey form you used properly.
Random sampling is the purest form of probability sampling. Each member of the population has an equal and known chance of being selected. When there are very large populations, it is often difficult or impossible to identify every member of the population, so the pool of available subjects becomes biased.
A random sample of 30 students is collected from the school (describe in details). The data on time spent daily by students in school to access the social media is recorded.
You can prepare a survey form to get the data of the 30 students.
Below are parts of the data collected. You can also include the info (name, interest, and others) of the respondent.
222
289
204
133
244
194
257
59
192
294
221
278
38
177
9
190
279
11
160
176
202
178
105
221
177
13
182
249
89
204
—02
You can construct three confidence intervals with different confidence levels.
—03
Using hypothesis test with 5% (1%, 10%) significance level.
—04
Assumption made
1. The data are sampled randomly because it avoids bias.
2. The sample values are independent of each other.
3. The data are collected from a random sample from large population (all students from KL).
4. The sample size is sufficiently large. Although the Central Limit Theorem tells us that we can use a Normal model to think about the behavior of sample means when the sample size is large enough, it does not tell us how large that should be. If the population is very skewed, you will need a pretty large sample size to use the CLT, however if the population is unimodal and symmetric, even small samples are ok. So think about your sample size in terms of what you know about the population and decide whether the sample is large enough. In general a sample size of 30 is considered sufficient.
5. The sampling distribution is normally distributed. The population is normally distributed.
6. Standard distribution is assumed as above formula.
Here are our most recent updates posts
- Feel free to check it out -
STPM 2021 Term 2 Exam Timetable
View the exam timetable for STPM 2021 Term 2. Countdown to STPM 2021 Examination. Join my tuition to help you achieve better results in the exam. Contact (60) 018-2016992 or kklee@kkleemaths.com for more information.

Integration of cos^3 x
There are many methods to integrate . 1. Use trigonometric identity Given that , -Here are our most recent updates posts- Feel free to...
STPM 2018 Term 3 Mathematics (T) Coursework Sample Answer
STPM 2018 term 3 mathematics (T) Coursework sample Guideline for solving STPM 2018 Term 3 Mathematics (T) PBS coursework assignment methodology Hint: Binomial Theorem Chi-Squared tests tabulate Thanks for helping in doing the survey. You can find...
STPM 2018 Term 2 Mathematics (T) Coursework Sample Solution
STPM 2018 term 2 mathematics (T) Coursework sample Guideline for solving STPM 2018 Term 2 Mathematics (T) PBS coursework assignment methodology Hint: limits L' Hopital rule Rationalisation Indeterminate Form Existance of limitsThanks the two students who sent me the...
Integration Booklet Page 10 Page 11 Solution
Here are our most recent updates posts- Feel free to check it out -
STPM 2018 Term 1 Mathematics (T) Coursework Sample
Question A complex number is an extension of a real number and it can be represented in Cartesian and polar forms. In this assignment, you are required to explore the powers and roots of complex numbers. 1 (a) Let z =1+i. Find z^n, where n = 2, 3, 4, …, and represent...
0 Comments