


STPM 2018 term 3 mathematics (T) Coursework sample
Guideline for solving STPM 2018 Term 3 Mathematics (T) PBS coursework assignment
methodology
Hint: Binomial Theorem
Chi-Squared tests
tabulate
Thanks for helping in doing the survey.
You can find the sample of the results below. Scroll down for all the sample answers and solutions.
Question
A researcher claims that 40% of Malaysians wear glasses. The number of people wearing glasses in a family may be modelled by a binomial distribution. In this assignment, you are required to conduct a study on the number of family members wearing glasses in k-member families with k>4. 1 Comment on the suitability of the binomial model in this situation. 2 By choosing one value of k, take a random sample of at least 50 families with k members. Tabulate the distribution of the number of family members wearing glasses. 3 Test the hypothesis that your sample data is from a binomial distribution with parameter p = 0.4. 4 (a) Explain how the test would be modified if the hypothesis to be tested that your sample data is from a binomial distribution with the parameter p unknown. (b) Carry out this test. 5 Comment on your results.I have conducted survey on the number of family members wearing glasses in 5-member families. The method i used to conduct the survey is using the Google Form. Thanks to the students who helped to fill in the form.
i. Each family member (trial) has two outcomes; wearing glasses and not wearing glasses.
ii. Fixed number of family members. (5 members)
iii. Independent, The probability of family member wearing glasses is assumed to be independent. We neglect the factors like genetic, races and sex
iv. The probability of success, p, is assumed to be constant for each family member.
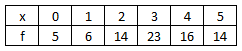
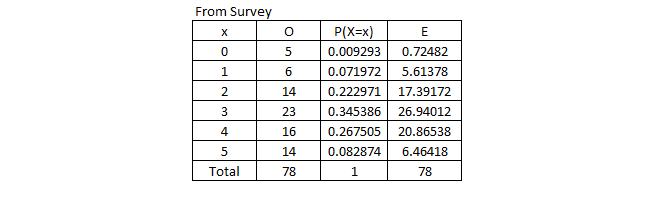
A total of 78 5-members families are chosen. The frequency distributions are tabulated as above.
Chi-squared test is used to test if the sample data is from binomial distribution with parameter p=0.4.
Significance level chosen is 5%.
H0: The number of family members who are wearing spectacles can be modelled by a binomial distribution with parameter p=0.4.
H1: The number of family members who are wearing spectacles cannot be modelled by a binomial distribution with parameter p=0.4.
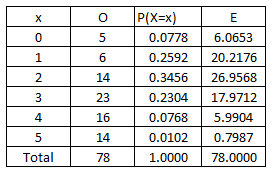
The values of P(X=x) is obtained using the formula of binomial distribution.
The values of E can be obtained by taking the P(X=x) and multiply with 78 (Total families in survey)
The survey was conducted using Google Form and all students are allowed to fill in the form with multiple times (even though they have been warned to fill in once). Therefore the data i used above is taken exactly from the survey from students.
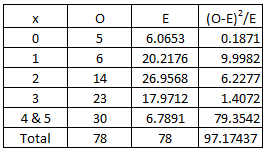
The expected frequency of the category x=5 is less than 5. Therefore the categories x=4 and x=5 are combined.
Please take note that the expected frequencies should not be less than 5.
Degree of freedom, v=n-1.
(n=the number of categories, 1=the number of restrictions)
For my case, v=5-1=4.
You can refer to the chi-squared distribution table. For my case, we test using 5% significance level, (we read 0.95 from the table), critical value = 9.488.
We reject H0 if the test statistic is larger than 9.488.
Test statistic = 97.17 (based on the table above).
Since the test statistic 97.17 > 9.488. H0 is rejected and it is enough evidence at 5% significance level, the data does not fit binomial distribution with parameter p=0.4.
Even at 0.1% significance level, H0 is also rejected because the test statistic is large.
4
(a) When the parameter, p is unknown, we have to estimate the p by using the property of mean of binomial = mean of data.
Another modification will be the degree of freedom. The number of restrictions is 2 now. So degree of freedom = n-2.
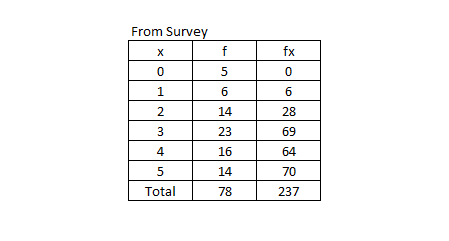
(b) We have to find mean from the data obtained from the survey. Please refer the table below.
Mean = 237/78=3.0384615384615384615384615384615
Mean of binomial = np = 5p
5p = 3.0384615384615384615384615384615
p=0.6076923
H0: The number of family members who are wearing spectacles can be modelled by a binomial distribution with parameter p=0.6076923.
H1: The number of family members who are wearing spectacles cannot be modelled by a binomial distribution with parameter p=0.6076923.
Significance level chosen is 5%.
The values of P(X=x) is obtained using the formula of binomial distribution, X ~ B (5, 0.6076923).
The values of E can be obtained by taking the P(X=x) and multiply with 78 (Total families in survey)
The survey data is the same as the Question 3.
The expected frequency of the category x=0 is less than 5. Therefore the categories x=0 and x=1 are combined.
Please take note that the expected frequencies should not be less than 5.

Degree of freedom, v=n-2.
(n=the number of categories, 1=the number of restrictions)
For my case, v=5-2=3.
You can refer to the chi-squared distribution table. For my case, we test using 5% significance level, (we read 0.95 from the table), critical value = 7.815.
We reject H0 if the test statistic is less than 7.815.
Test statistic = 14.58534 (based on the table above).
Since the test statistic 14.58534 > 7.815. H0 is rejected and it is enough evidence at 5% significance level, the data does not fit binomial distribution with parameter p=0.6076923.
But at 0.1% significance level, H0 is not rejected because the test statistic is smaller compare the critical value (16.27).
5
At any level of significance, the sample data does not fit binomial distribution with p = 0.4.
The Chi-square test show that the sample data does not fit binomial distribution with p = 0.6076923 for any level of significance, except 0.1%.
Here are our most recent updates posts
- Feel free to check it out -
STPM 2015 MT Chapter 8 Booklet A Page 20 Problem 11 Question 14
Given that ")

2015 MT Chapter 8 Booklet A Page 20 Problem 11 Question 11
Given that ^2")
\frac{d^2y}{dx^2}-x\frac{dy}{dx}-2=")
STPM 2013 Mathematics (T) and (M) Final Grade
This is the collection of the final grade of the new STPM Mathematics (T) year 2013. The final grade of Mathematics (T) is based on the grade of Paper 1, Paper 2, Paper 3, and Paper 4(PBS). All the exam marks are hidden and it is hard for STPM students to determine...
2015 MT Chapter 8 Booklet A Page 20 Question 6
Given that -x+\frac{1}{2}x^2")


2015 MT Chapter 8 Booklet A Page 20 Question 10
If 
^2=1+3\sec^2 y")


^2+1=")
2015 MT Chapter 8 Booklet A Page 20 Question 8
Given ")
^2+p^2=0")
this is great help but Q4 and 5 are missing…
i want to ask that the hypothesis test same as the chi squared test in Q3? Or the chi squared test is a part of the hypothesis test?
Chi-squared test is hypothesis test.
Thank you so much for the guides. Really helping.
How do you calculate P(X=x) for Question 3 ? I calculated it by applying binomial distribution formula but I dont seem to be able to obtain the same answer as yours after several attempts.
5Cx (0.4)^x (0.6)^(5-x)
What is the reason to increase the number of constrictions to 2 for degree of freedom , but not to 3 or 4 ? In question 4 .
Degree of freedom, v=n-1. (n=the number of categories, 1=the number of restrictions) when parameter is known.
The number of restrictions is 2 when the parameter is unknown. So degree of freedom = n-2.
It is mentioned in the post above. If you need further explanation, please google.
Why for the question to do the hypothesis test for unknown parameter must be using degree of freedom v = n-2?
Degree of freedom, v=n-1. (n=the number of categories, 1=the number of restrictions) when parameter is known.
The number of restrictions is 2 when the parameter is unknown. So degree of freedom = n-2.
It is mentioned in the post above. If you need further explanation, please google.
Is the question 5 answer this short only?
It depends on your teacher.
Can I do 4 categories combined into one? Because the expected value of the 4 categories from my survey is too small.
You should increase the total n
Is there the first is the answer for the comment of suitability of binomial?
You can explain in more details in your submission
Is that the first one is the answer for comment of the suitability of using binomial?
Can u give some tips about to how write the methodology?
can you write out the conclusion?
thank you so much!
Thank you for the reference for all of us form 6 students. It helps us a lot. You have my upmost gratitude 🙂
You are welcome.
Thank you for the reference for all of us form 6 students for all terms. It helps us a lot. You have my upmost gratitude 🙂
You are welcome.
In conclusion parameter p known (0.4) or p unknown is more suitable?
Both can be suitable. It depends on how you explain it.
Which one is more suitable to conduct this survey? With p known or unknown?
Which one is more suitable to conduct this survey? With p known or p unknown?
What is the conclusion? Which 1 is more suitable?
Thanks a lot for the reference. But I would like to ask about my test statistic. Both of it are very large and when p=0.4 and p is unknown, H null are both rejected too. Then, could I write this statement:”the result show p-cap=0.275 is more suitable than the parameter p=0.4?” in the conclusion?
Yes
It’s regarding the conclusion.. My first result with p=0.4,Ho is rejected at 5%sl.. Then with p unknown, Ho is rejected at any level of sl except 0.01%. So my conclusion which one is more suitable?
May i ask is it suitable for me to write “the result shows that the parameter, p-cap=0.275 is more suitable than the parameter, p=0.4” in the conclusion as both of my test statistics are very large no matter for p=0.4 or when p is unknown, and the H null are both rejected too.
Is it possible that the test statistics go beyond than 200+???
why k must be greater than 4?